
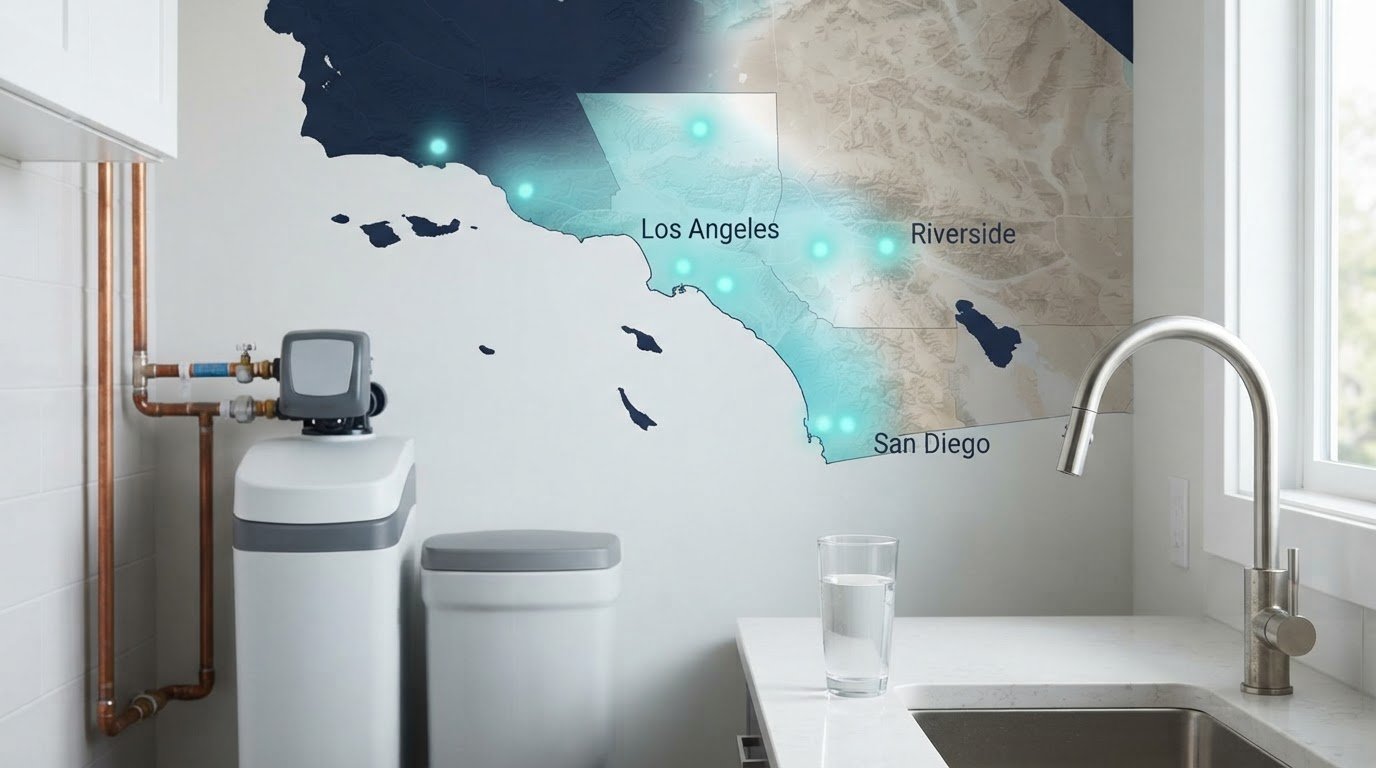
Southern California water hardness can vary sharply from one city to the next, so one regional figure won’t describe every tap. A Southern California water hardness map shows examples ranging from 175 PPM in Long Beach to 307.5 PPM in Santa Monica. Hardness comes mainly from dissolved minerals, including calcium and magnesium, picked up as water moves through local geology.
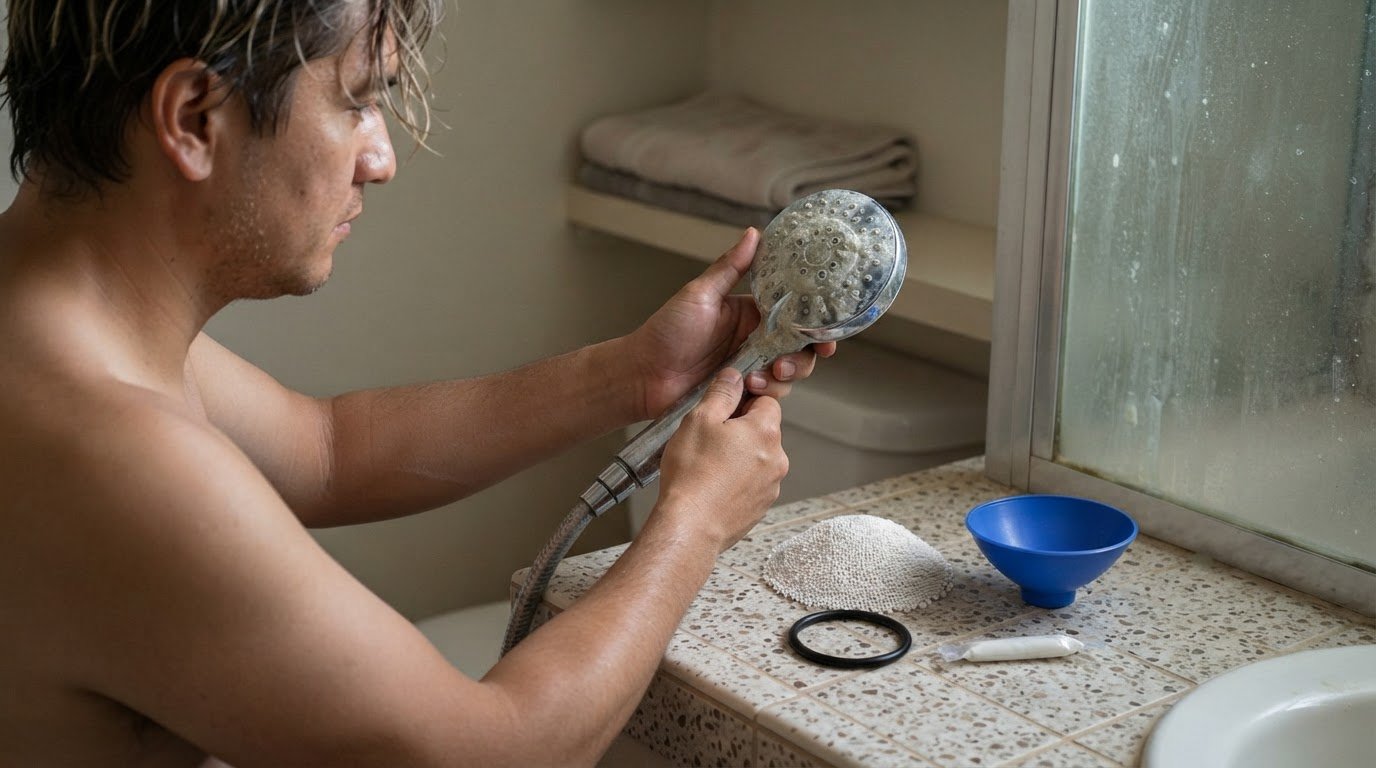
If you’ve noticed spots on glasses, scale on fixtures, or soap that doesn’t rinse away easily, your local water is worth investigating. A Southern California water hardness map can show city-level differences, but the supply at your address may come from a particular utility or private well.
Learn what causes hard water, compare reported levels across Southern California cities, and find local readings for your ZIP code. You’ll also see how parts per million (PPM) and grains per gallon relate, making the figures easier to interpret when considering your household’s needs.
City readings vary with local water sources and dissolved minerals. Use regional maps for context, not as a measurement of the water in your home.
City comparisons show how differently Southern California supplies can measure. Long Beach is listed at 175 PPM, while Santa Monica is 307.5 PPM; Anaheim is 329.0 mg/L. The U.S. Geological Survey says its hardness map illustrates 1975 data that remain accurate and useful in current assessments. That map provides broad historical context, while city figures offer a closer comparison. Elsewhere, Sacramento is listed at 83 mg/L, while Phoenix is reported at 16 gpg. These examples show why place and measurement units matter.
Classification bands translate a measurement into a plain-language description. Water from 0-60 mg/L is soft, 60-120 mg/L is moderately hard, and 120-180 mg/L is hard; above 180 mg/L is very hard. Above 250 PPM is classified as extremely hard. California residents’ average is listed as 100-300 PPM, a broad range that spans multiple categories. Calcium and magnesium are the main dissolved minerals associated with hard water.
Hard water may affect how hands feel after washing and how clear drinking glasses look. Mineral scale may also build up in plumbing and appliances. A hardness figure alone does not tell you whether a water softener is allowed or restricted. Maps report water data, not local equipment rules, so check applicable local requirements before deciding.
Groundwater and imported supplies can differ in hardness because their mineral content reflects their sources and treatment. Groundwater picks up minerals as it moves through local geology; imported water comes from a different source and may be blended with other supplies. The label alone doesn’t determine which tap is harder. The key is the calcium and magnesium present in the water reaching your home.
A 1975 map isn’t a 2025 address-level reading. For a current household figure, use a recent utility report or a home or laboratory water test; testing gives the exact hardness number for that water.
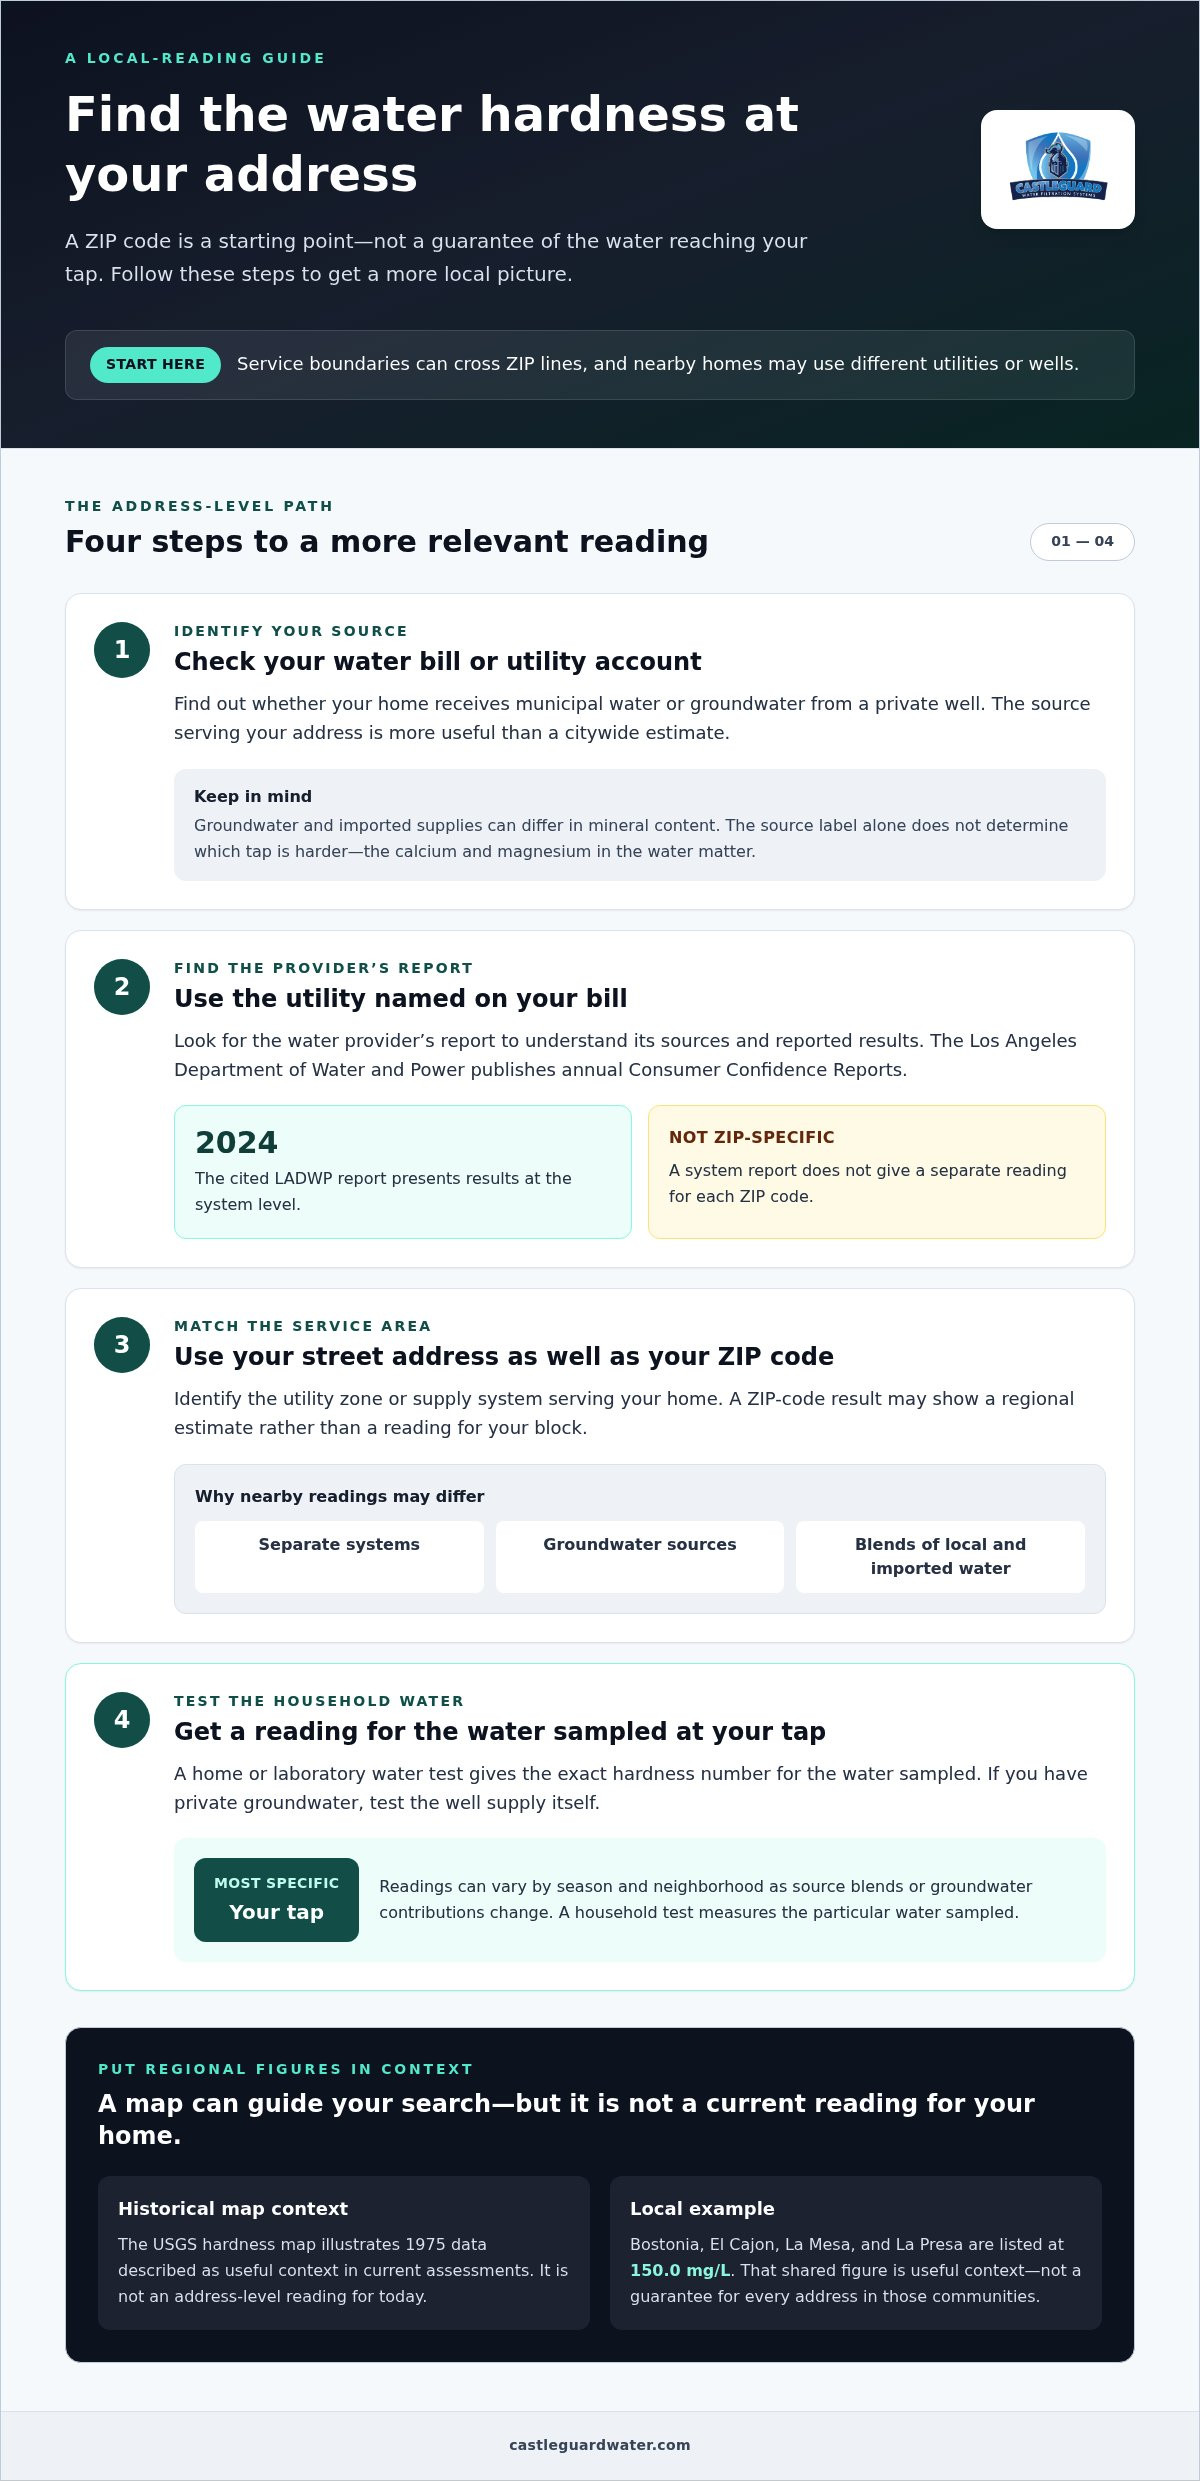
A ZIP code narrows the search but may not identify a single water source. In Southern California, service boundaries can cross ZIP lines, and nearby homes may receive water from different utilities or wells. Start with the provider named on your water bill, then use your address to identify the relevant service area. This helps you avoid relying on a citywide estimate that may not reflect your tap.
Use these steps to build a more local picture:
Neighborhood differences can reflect separate systems, groundwater sources, or blends of imported and local water. In San Diego County, Bostonia, El Cajon, La Mesa, and La Presa are listed at 150.0 mg/L, illustrating how a local group of communities can share a reported value. That figure is useful context, not a guarantee for every address within those communities.
Readings may vary by season and neighborhood as utilities change source blends or local groundwater contributes differently to the supply. Magnesium and other dissolved minerals affect hardness, so a source change can alter the mineral profile at your tap. Compare reports from the same utility system and reporting period. If you need a reading for your own water, use a household test.
Water reports may express hardness as parts per million (PPM), milligrams per liter (mg/L), or grains per gallon (gpg). These units describe the concentration of dissolved minerals, including calcium. Comparing readings means checking both the number and its unit. A value of 10 gpg cannot be compared directly with 10 PPM because the scales differ.
To convert grains per gallon to mg/L (ppm), multiply the gpg value by 17.1. For the reverse conversion, divide the mg/L reading by 17.1. For example, 171 mg/L converts to 10 grains per gallon using this method. This lets you compare a utility report with a test result, even when they use different units.
Those California examples show why units matter: San Francisco’s 62 mg/L is lower than Fresno’s 129 mg/L, though each city’s figure uses a different-looking scale in some reports. California’s listed average is 5.75 grains per gallon, while a statewide range is approximately 5.8-17.5 GPG. A separate set of California city data gives an average of 98.4 mg/L, or 5.8 grains per gallon. Read each figure with its source area and unit, rather than treating averages as a household result.
Classification bands provide another way to interpret a measurement. One scale lists 0-60 mg/L as soft, 60-120 mg/L as moderately hard, and 120-180 mg/L as hard. The corresponding grains-per-gallon bands are 3.5 to 7 for moderately hard and 7 to 10.5 for hard. Above 180 mg/L is very hard, while water above 250 PPM is classified as extremely hard. These categories help explain reports, but the actual reading and unit remain essential.
City figures show genuine differences across the region, but units and reporting methods matter. Compare each value with its city and water-source context before applying it to your home.
Southern California city readings range widely, so a regional average can conceal local contrasts. Los Angeles is listed at 177.7 PPM, while Santa Monica is 307.5 PPM and Fullerton is 333.0 PPM. Ventura’s listed value is 666 PPM, far above Corona’s 169 PPM. These figures help you compare reported city levels and understand why minerals and potential scale concerns can differ by location.
Other examples add detail: Orange is listed at 290.7 PPM, Pasadena at 196 PPM, and San Bernardino at 242.7 PPM. Water softeners address hardness, but a city figure alone doesn’t tell you what a particular home needs. Check the reading’s unit and whether it describes a city, county estimate, or individual supply.
Municipal water reports describe a utility’s supply and can help explain local readings. The Los Angeles Department of Water and Power publishes annual Consumer Confidence Reports summarizing water sources, detected substances, and compliance status. Its 2024 Water Quality Report presents results at the system level, so it provides context for Los Angeles rather than a separate hardness result for every address.
Find the report for the utility serving your address, then compare its stated water source and reporting period with any city-level hardness figure. A municipal report and a hardness estimate may answer different questions: one summarizes system water quality, while the other focuses on minerals associated with hardness. Keep their purposes distinct.
Hardness differences don’t by themselves indicate a safety issue. A map or municipal report may help orient your comparison, while testing can provide a more specific picture of hardness in your tap water. If your home relies on a private well rather than municipal service, explore well water system options suited to that source.
CastleGuard’s City System is an option for homes on municipal water seeking whole-home water protection. Use your local hardness reading alongside what you notice, such as mineral scale or spots on fixtures, to clarify your priorities. A city estimate can guide your questions, while a household test gives a reading specific to your tap. For private wells, CastleGuard also offers Well Water Systems. The right starting point depends on your water source and household priorities, not a regional average alone.
To discuss water-system options for your home, visit CastleGuard online.
Use the Southern California water hardness map as a starting point, then base your next decision on your household’s water source and priorities. Clarifying what you want from a water system can help you focus on suitable options instead of choosing by a city estimate alone.
CastleGuard offers a City System for homes using municipal water, Well Water Systems for private wells, and Ultraviolet Systems. Each serves a different need, so consider your water source and what you want to address. Explore the options that fit your household and take the next step when you’re ready.
Contact CastleGuard about your water to explore the available options. A thoughtful, informed choice can make caring for your home’s water feel more manageable.
Among the Southern California city readings provided, Victorville has the lowest listed hardness, at 34 PPM. That reading falls within the soft category on the classification scale used in this guide. Treat it as a city-level comparison, not a reading for every household in Victorville. Your home’s supply depends on its water source and service area, so an address-specific test offers a more personal result.
Water hardness measures dissolved minerals, mainly calcium and magnesium. Higher mineral concentrations can contribute to scale on fixtures and appliances; lower readings indicate softer water. Hardness is not a complete water-quality assessment, since a hardness number does not describe every substance in a supply. A utility report, for example, may include other water-quality results alongside hardness information.
A city map compares reported hardness readings across locations, rather than measuring each home individually. Examples include Long Beach at 175 PPM, Pasadena at 196 PPM, Irvine at 231 PPM, and Santa Monica at 307.5 PPM. Use the city name and unit to interpret each result. A neighboring city’s reading may not match your home if its water comes from another system or well.
Reported readings include Los Angeles at 177.7 PPM, San Diego at 207.5 PPM, and Riverside at 194 PPM. Orange County readings can differ by city, so a city-level figure may not reflect every household’s water. These examples use PPM or mg/L, which are equivalent units for hardness readings. Compare like units and specific locations.
Reports commonly use PPM, mg/L, or grains per gallon (gpg). To convert gpg to mg/L (ppm), multiply by 17.1; to convert mg/L to gpg, divide by 17.1. For example, 171 mg/L equals 10 grains per gallon using this conversion. Check the unit before comparing readings, since the same numeric value on different scales does not mean equal hardness.
Start with the water utility listed on your bill and find its report for the service area covering your address. Because a ZIP code can cross utility boundaries, match the provider and system, not just the city name. If you use a private well, test a sample from that supply. A home or laboratory test gives the hardness reading for the sampled water.